Your database, watched like a DBA would.
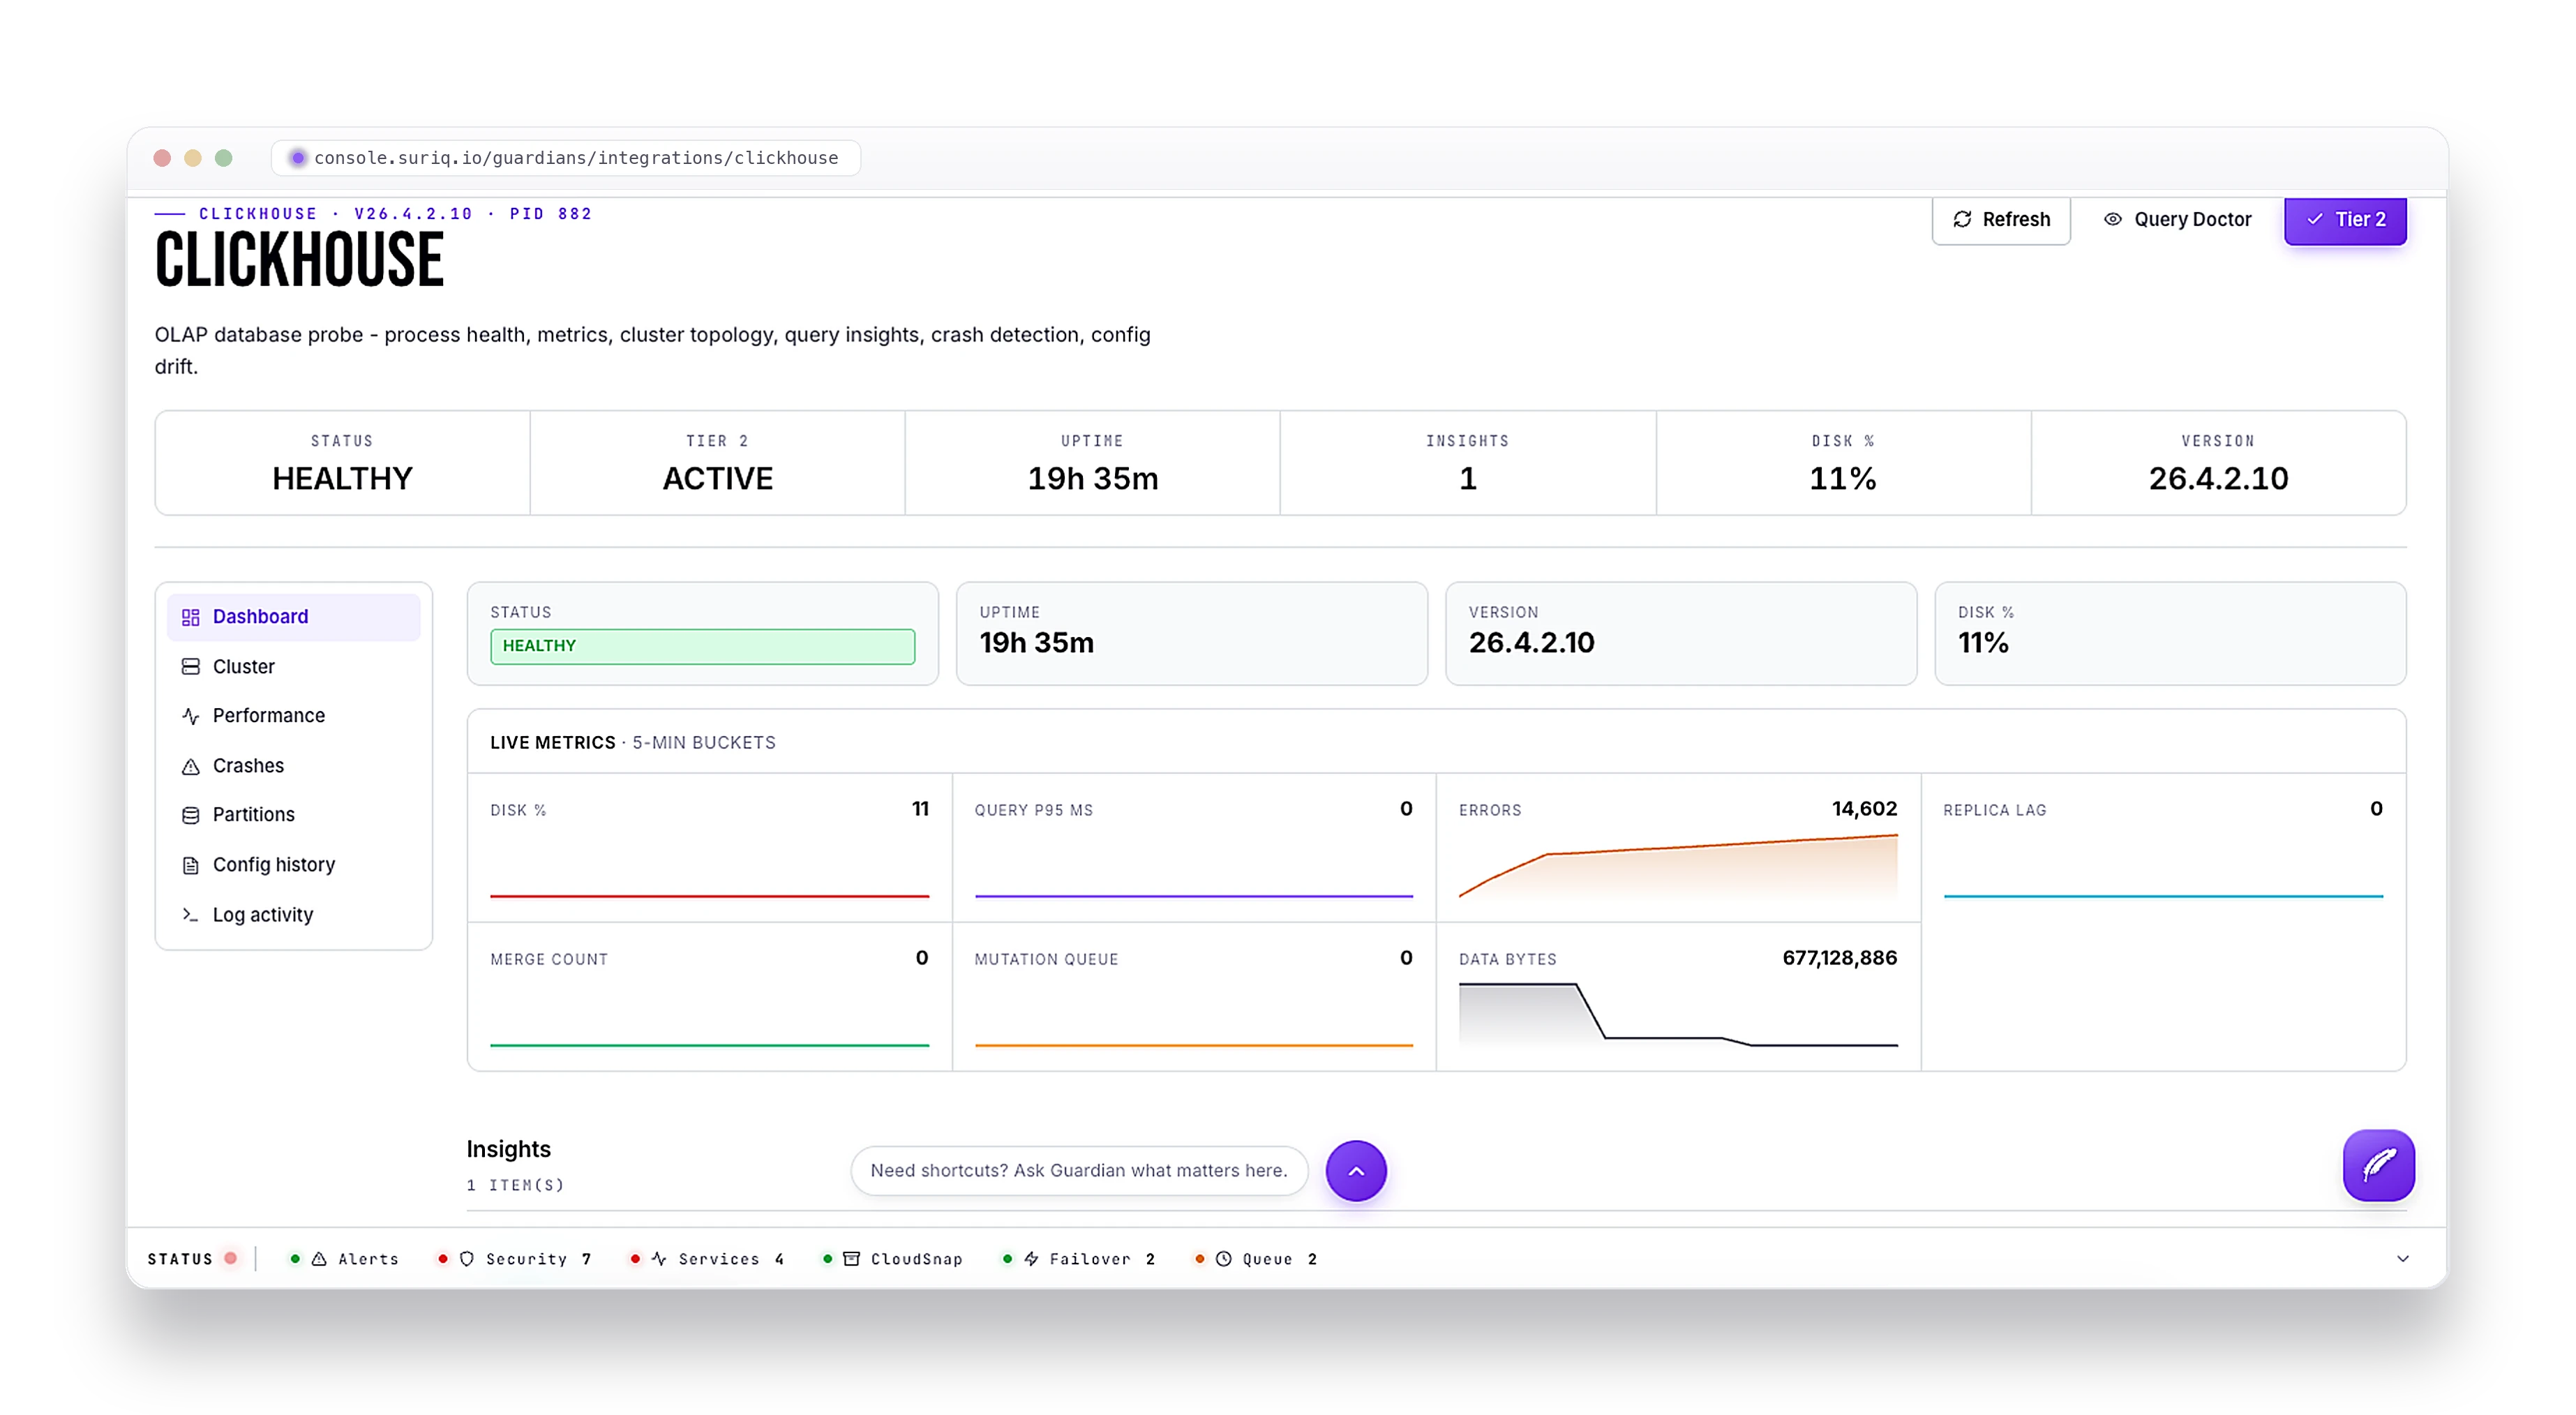
Suriq probes your ClickHouse and turns it into a live health view - process and disk, running queries, cluster replicas, crashes, and config drift - right next to the alerts for the same server. No new dashboards to babysit.
It reads the database - and tells you what is actually going on.
ClickHouse comes in two tiers. The first lights up the moment a Guardian lands on the host, with no database credentials at all. The second is opt-in: connect a read-only probe user and Suriq starts reading the engine's own system tables for query-level insight.
- Live process health - up or down, uptime, memory, and CPU for the server
- How full the data disk is, and the size your tables are taking up
- Which ports are listening, and a warning when one is open to the internet
- Crashes and fatal errors pulled straight from the server log, in plain language
- Config drift on config.xml, users.xml, and the drop-in fragments - so an out-of-band edit never slips by, with users.xml changes treated as high severity
- Live metrics in 5-minute buckets - disk, query p95, errors, replica lag, merges, mutation queue, and data size
- The queries running right now, with the ability to cancel a runaway one
- Your slowest query patterns, with an AI Query Doctor that returns concrete fixes - not vague advice
- Cluster topology across shards and replicas, and a flag when one replica's config has drifted from its peers
- A crash post-mortem that reconstructs the timeline, names the likely cause, and suggests next steps
- Your biggest partitions by storage, with a "what if I dropped this" estimate before you run it
- A capacity forecast that warns when disk or the mutation queue is heading toward trouble
- A security read on your database users and grants, and a flag when the default user has no password and is not locked to localhost
- Kill a runaway query or a stuck mutation in one click
- Reload config or flush logs without restarting the server
- Optimize a partition or sync a lagging replica when it needs a nudge
- Reclaim disk by pruning ClickHouse's own log tables when a box is running tight
- Every action gated by role, logged, and high-risk ones held behind a type-to-confirm
Tier one reads what the server already exposes - the process, the data directory, listening sockets, the config files, and the server log - so it works on any ClickHouse host with nothing to install. Tier two adds a read-only probe user that reads the engine's system tables for the deep view, with credentials kept in the vault. The AI features - the Query Doctor, the crash post-mortem, and the drop-partition estimate - are advisory: they hand you the DDL to copy, they never run it for you.
Stop SSH-ing in to check on your database.
Deploy a Guardian and ClickHouse shows up in the console - read live, tied to your incidents, and ready to act on.